

The nearly-criminal prohibition against positive COVID19 news in the media continues, leaving sites like GraniteGrok to report the truth. Our reward is that we’re right because the state’s own data proves it. And we intend to continue reporting that truth in 2021. So, where are we on New Year’s Eve?
Related: Panic Porn: NH Media Reports 20,000 More NH Cases in December – Ignores What Really Matters
At the beginning of December, the state reported close to 1000 new cases a day. This lead WMUR to announce that over49% of all positive tests in 2020 had occurred in December. What they left out was that over the past week, this meaningless number had become even less so, dropping to about 150 a day.
We’ve been publishing a daily Threat Index since 12/14, so we’re in a great position to look at what all those positive tests meant. The correct response is pandemic? Casedemic? How about, let my people go.
Here is the state’s so-called epidemic curve.
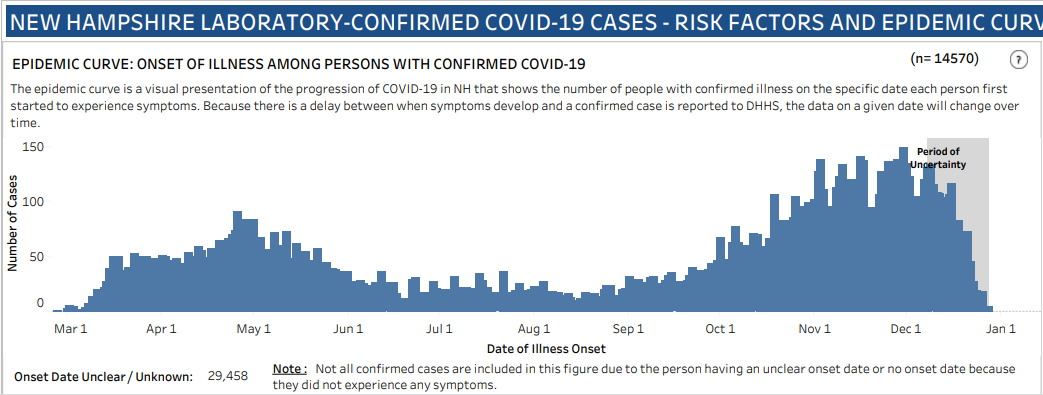
It is little more than a graph of positive cases with the presumption of clarity about what this means. We’ll tell you. Not much.
The current casedemic peak for this flu (using this graph) is around December 1st, which coincides with the peak of testing. If the peak of testing can produce a peak of positive tests (it did), then using the two-week rule for quarantine and our data (which began 12/14), we can glean some real meaning.
Remember, the political response is all about cases, which means everything else is as well.
From 12/14 to 12/30, a full month after the positive test peak began, hospitalization and deaths have declined in every age group.
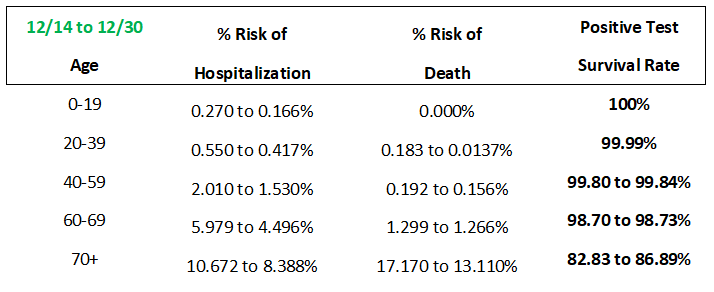
This means that an increase in positive test results produced a decrease in people needing to be hospitalized or dying with or from COVID19 (it is still unclear how the state is reporting that).
This means what? That to a majority of the state cases mean nothing; stopping their spread means nothing and not just because they can’t do it.
WMUR claims the December spike accounts for nearly 50% of all positive cases reported for NH in the whole year. A spike that happened right after the Governor’s mask mandate. Maskholes will say it’s your fault, but that is only true in that you allowed the state and towns to abuse you for no reason. Nothing was stopping a rise in cases, and as we’ve pointed out, that rise means nothing for most people.
Failure was baked in.
Nearly 80% of these deaths, all tragic, involved persons in Long Term Care Facilities. The oldest and most at risk. In the care of who? Masked and sanitized experts working for the State.
If we remove them from the calculus, the odds of someone in NH under 70 needing hospitalization is 1.23%, and of dying from COVID19 after testing positive is 0.1875%.
If you are 59 or younger, that drops to 0.78% and 0.067%, respectively.
Pandemic? If by that you mean just about everyone will get this flu, I suppose, but if only a small portion of the population is at risk, and we can see that the state’ can’t even manage to protect them, what makes you think they could protect you even if you were at risk?
They can’t, so in the interest of liberty, freedom, and constitutional rights, it would be best if we dropped the charade, closed the curtain on the political theater, and went back to letting people and businesses decide how to proceed.
The state is not just dishonest, at the least misleading, and in the end, incompetent.
New Year’s resolution. Stop buying their BS; it’s harming people who have nothing to fear from SARS CoV2.
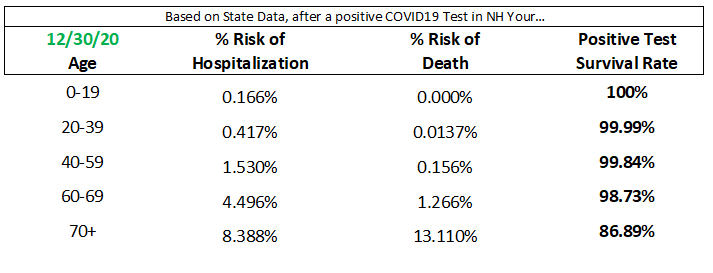
Here is today’s NH Threat Index (State’s 12/30 case data can be found here).
Previous Reports (published date – Case Summary date will be the day before the republished date)
- New Hampshire COVID19 Threat Index Update 12/15/2020
- New Hampshire COVID19 Threat Index Update 12/16/2020
- New Hampshire COVID19 Threat Index Update 12/17/2020
- New Hampshire COVID19 Threat Index Update 12/18/2020
- New Hampshire COVID19 Threat Index Update 12/19/2020
- New Hampshire COVID19 Threat Index Update 12/20/2020
- New Hampshire COVID19 Threat Index Update 12/21/2020
- New Hampshire COVID19 Threat Index Update 12/22/2020
- New Hampshire COVID19 Threat Index Update 12/23/2020
- New Hampshire COVID19 Threat Index Update 12/24/2020
- New Hampshire COVID19 Threat Index Update 12/25/2020
- No 12/25/2020 case update.
- New Hampshire COVID19 Threat Index Update 12/27/2020
- New Hampshire COVID19 Threat Index Update 12/28/2020
- New Hampshire COVID19 Threat Index Update 12/29/2020
- New Hampshire COVID19 Threat Index Update 12/30/2020