
Good morning and welcome to a new recurring feature on the ‘Grok. These updates will take New Hampshire’s most recent COVID19 Case Summary Report and calculate the Actual risk or threat percentage that SARS CoV2 represents to Granite Staters based on age groups.
Related: The Concord Monitor Thinks COVID19 Could Be To Blame for an Additional 440 Deaths in NH
One quick point before proceeding. I do not have a fixed format for this yet, so it may look different from one update to the next, but the data will be handled the same way regardless, ensuring that the numbers we provide (based on the state’s updated data) are as accurate as possible.
Our results will ignore any noise from either side on any policy preferences and focus on what matters. The likelihood of hospitalization or death as a percentage of those the state reposts as having tested positive.
This in turn will educate the population in a meaningful way about what cases and infection rates mean in real terms so that they can make their own assessment about the relevance of actions or inactions taken by anyone regardless of political or policy preference at either the state or local level.
Note: You, and you alone are responsible for making decisions about health risk based on your or your family doctor or other health professionals’ understanding of your personal health situation.
Today’s update is based on New Hampshire’s 12-14-2020 COVID19 Case Summary Report.
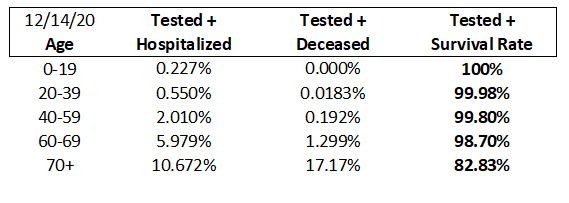
Tested + Hospitalized is the percentage of people NH claims produced a positive COVID19 Test result in that age range and required hospitalization.
Tested + Deceased is the percentage of people NH claims produced a positive COVID19 Test result in that age range and Died of COVID19.
Tested + Survival Rate is the percentage of people NH claims produced a positive COVID19 Test result in that age range and lived to tell the tale.