
As I said in the prologue, numbers tell a story. While many of us scratch our heads on the split party results on the state government races versus the federal level races, we wonder why this story does not seem to make sense. Why doesn’t our hat match our jacket?
Related: A Little Red State with a Big Blue Crown – Prologue
We’d like to thank John P. Christi for this Op-Ed. If you have an Op-Ed or LTE
you would like us to consider please submit it to Skip@GraniteGrok or Steve@GraniteGrok.com.
Since we already previously established that the state-level races moving solidly to the Republicans was an unsurprising and expected result, we will focus on the federal level contests results to see what exactly the story is that we are being told.
It is November in New England after all, so everyone gather around our virtual backyard fire pit for a reading of the chapters and sub-plots of the tale of the 2020 NH General Election, or as I prefer to call the story, “A Little Red State with a Big Blue Crown”. Keep in mind all I am doing here is translating a book of numbers from the Secretary of States Office into English.
Chapter 1: The Crown Jewel
Let us dig into the four federal races one at a time (numbers rounded for efficiency). The top of the ticket is of course the race for President of the United States. The data tells us an intriguing tale of the unexpected.
The data tells us the story that Joe Biden won and swept an impressive 8 of NH’s 10 counties. To put this into context, Hillary Clinton only won 4 counties in her 2016 narrow defeat of Trump here, and not even the two most populated ones. Ok, I guess Biden could have done better than Clinton, that is within the realm of plausibility. Let us also consider that Barack Obama only won 6 counties here in 2012. Well, that seems surprising even though Obama was less popular with his 2012 win than his 2008 win, it was still a pretty decisive win. Ok, so what about in that “Democratic Peak” I keep talking about in 2008, there is no way Joe Biden won more counties than Obama did then, right? Well, actually that’s true, Obama won all 10 counties in 2008. Phew, that would be kind of outlandish to think that Uncle Joe could outperform 2008 Obama, who whether you liked him or not was at “Rockstar” status back then.
So, now that we know 2020 Biden did not outperform 2008 Obama in county totals, maybe this whole thing makes a little more sense at least when put into that context.
Except for one thing.
2008 Rockstar Obama got about 385,000 votes here in NH in his historical win; a record setting vote get that no other candidate has come close to in the Granite State. Well, it turns out Biden got about 425,000 votes. That’s right, the story says here that Joe Biden 2020 earned about 40,000 more votes than Obama 2008, not only winning but creating a new and much higher “Democratic Peak”.
For a quick reference, here is the chart I made back in September showing the trajectories which were set to cross in 2020 and result in NH going solid red.
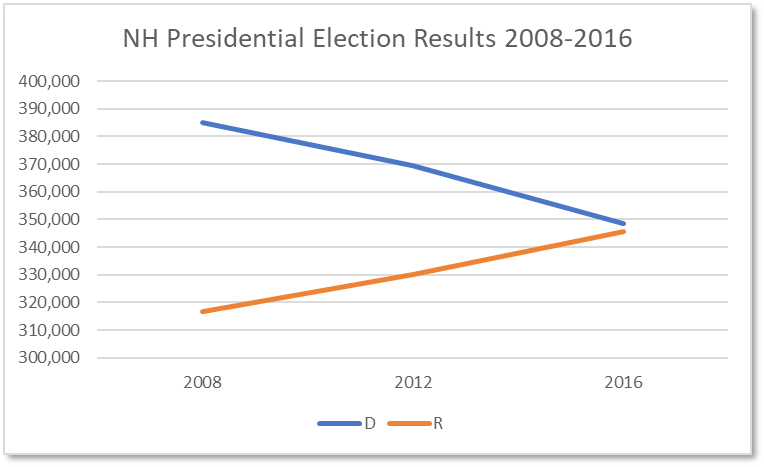
If you plotted trendlines of the results prior to the election you would expect Trump to finish around 365,000 and Biden at around 330,000. Instead, our story goes that yes Trump did finish precisely where the line would have extended, and he did get 365,000 votes. But, Biden did not head down the path to 330,000 and not only deviated from that trajectory but completely upended and contorted the graph so brutally as to turn the 2020 chart into a piece of abstract art. He got almost 100,000 more votes than expected by the trend.
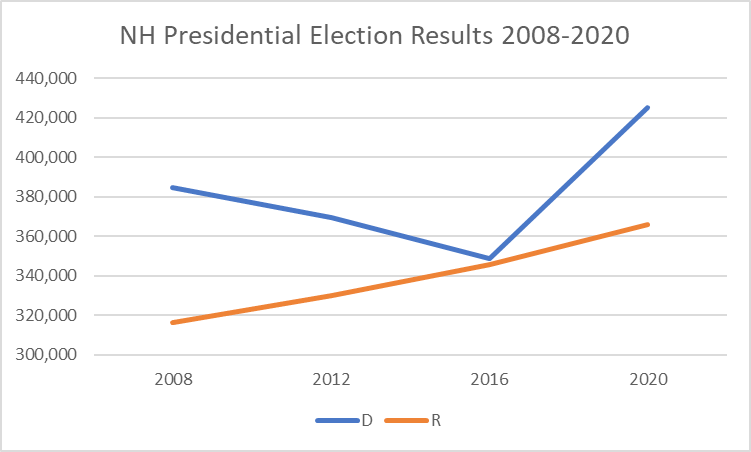
Let us also keep in mind that this occurred while Trump stayed right on track, the line extends flawlessly. This held as well for the state races as a whole, leading to the now full party control of Governor, Executive Council, State Senate, and State House. Ok, so the data is not helping us paint a picture that makes our “red state, blue crown” narrative make any more sense, it actually makes it more confusing. If we take the Romney Theory that Republicans voted straight ticket except against Trump, we would not see Trump stay on the upward slope as he did. Also, Trump’s consistent party approval of 96% and record turnout across the country in uncontested primaries kind of deflates Mitt’s theory. So, the question ends up being more, how did Biden bend that curve, and so hard?
Some have suggested nefarious actions could be causing the remarkable results. Many people are recently learning about Benford’s Law. The topic was even featured on this website this past week in reference to a sample from Milwaukee, with a good technical explanation. I teach in a business school, but I am not a forensic accountant. However, I also have taught college level statistics for several years and have run tests with Benford’s Law before. I have not seen if anyone has tested it with NH’s data; so, I did.
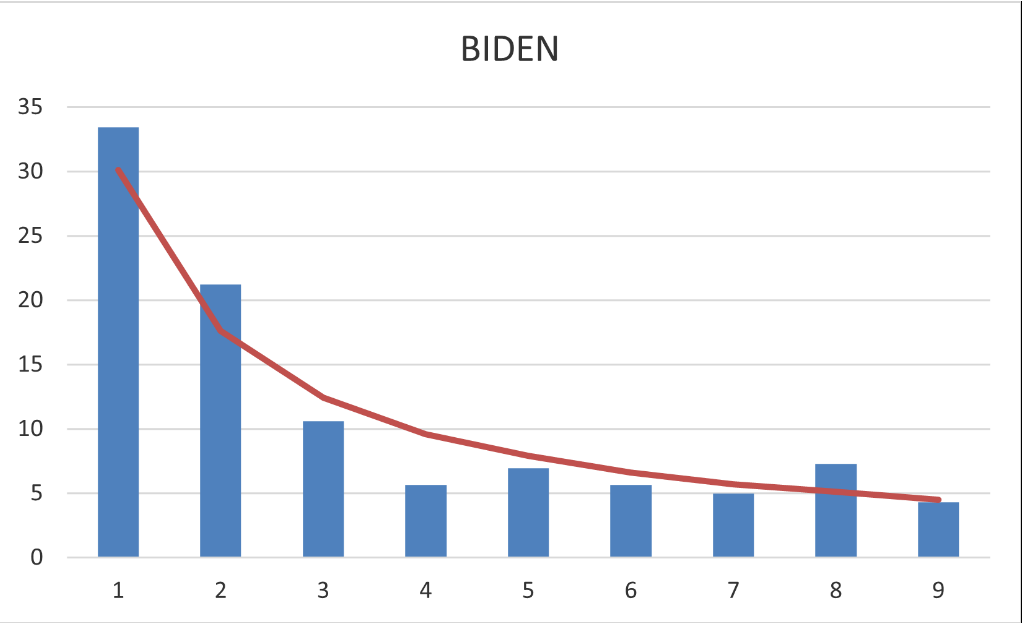
It is important to keep in mind that Benford’s Law gives you an expected distribution of values. It can be used as an indicator of potential fraud but is not proof of fraud on its face. In the chart above we see the blue bars plotting the distribution of Biden votes here in NH as a histogram using the method to compare it to the expected distribution, which is the orange line. In this case, the 1, 2, and 8 position would stick out as being over-represented in the distribution. This does not mean that they are fraudulent, but it would be a good first level screening tool to refine where to look to next if fraud were suspected. In the dataset a pivot table can be made that would then provide a subset of locations that can be further focused on in the 1, 2, and 8 categories. It is safe to say that the results do not fit the line well. What about Trump’s results?
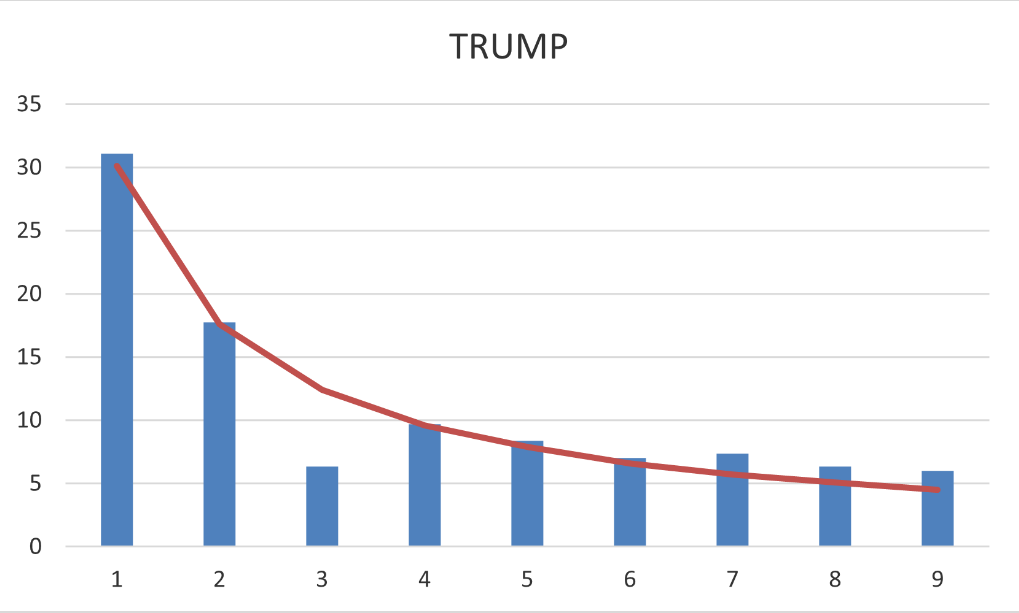
They are not perfect either, but they are much closer to the expected distribution than the Biden set. You can see that the top of the blue bars terminate much more consistently to the Benford line of expected values. A criticism of using the Benford technique on election data is that there might not be enough difference in the orders of magnitude with the dataset. For example, if there are mostly towns/wards that report results between 1,000 and 1,999; which in NH there are a good amount. Either way we can say that Trump’s distribution adheres to the expected Benford distribution much better than Biden’s.
Finally, our story of the crown jewel race concludes with Joe Biden, who came in last place in the NH primary just months before, massively outperformed Barack Obama of 2008 (and 2012). All this while the Republicans kept on pace for their vote growth, even for Trump who stayed exactly on track. The theory of Republicans voting for Biden is not supported by the story the data just told. So, where did all that support come from? We might still be confused, but we can at least rule out the Romney Theory, and be a little less bewildered as a result. It would be irrational to conclude from the data that Republicans voted for Biden over Trump in NH.
If you found chapter one to be an outlandish account and you cannot tell if what we are dealing with is fiction or non-fiction, just wait until chapter two: The Senate.