
Back in November 2020, it was clear that WMUR was pushing the “COVID Epidemic Panic Porn” every time it could. Fine, it was a big story as no one knew what was going on (still) at that time.
But all they blared were raw numbers and never the entire context. Their “universe” of reporting was only within the COVID numbers themselves: cases, infection rates, hospitalizations, and of course, Deaths (capitalization intentional as that was their main lede. Instead of “If it bleeds, it leads” it seems to be a constant “If it flops over, it leads”.
Sure, death is not something we wish for but ever since, it’s like a gleam in their collective loudly hushed voices as the chyron at the bottom of your screen doubles up what is in the “upper 2/3rds”. One would expect context from a news organization and we’ve gotten zippo from WMUR. Why only the infected population instead of the overall NH population as a contextual data point?
And deriving your infection percentages from that smaller number (and death rates as well)?
That served no purpose other than scaring people. So at the time, I put up a post (“Data Point – WMUR is New Hampshire WuFlu Panic-Port (How About Some Context?)“) as no one else was. What was the number of “excess deaths” resulting from COVID above and beyond what had been the “normal” rate of death here in NH against the overall NH population? Answer:
The total cumulative cases add up to 15,749 out of a total population of 1.32 million residents. Do the math: 1.2%. With deaths at 497, that’s an “excess death rate” of 1.5 over a normal NH death rate /day of around 31-32.
WMUR News readers – hoisted by their own petards (and lack of doing their jobs). But do you think they’d put up these charts and spend 30 – 45 seconds on the context? How about having the FABULOUS Dr. Chan go over the entire lifecycle with these? Or Gov. Sununu?
Nope, not happening – we keep getting more and more Emergency Orders taking decisions about our evaluation of risk away from us.
And down the road, they’re all back doing it again. And they are all back doing it, on TV, without a full context again. So, an Update. First, today’s overall snapshot:
Also, it is QUITE clear that this is an Old Person’s Disease where the important stat is surely about one’s age but also the number of co-morbidities (which is hardly ever mentioned by WMUR, Dr. Chan, or SunuFlu:
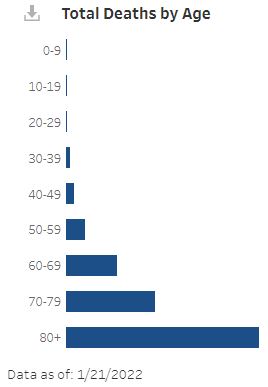
In and of itself, that chart only shows the relative amounts of one age against another. At the NH Covid Dashboard, it is interactive, so we have the absolute numbers as of Friday (today is Sunday) over these TWO years: 2,135
0-9: ONE (0% of all deaths)
10-19: ZERO (0% of all deaths)
20-29: 4 (0.2% of all deaths)
30-39: 22 (1.0% of all deaths)
40-49: 44 (2.1% of all deaths)
50-59: 109 (5.1% of all deaths)
60-69: 301 (14.0% of all deaths)
70-79: 523 (24.3% of all deaths)
80+: 1,131 (53% of all deaths)
When you add up the numbers from 50+, that’s 96.4% of all COVID deaths. But be skeptical of those absolute numbers because several reports coming out, similar to those that are saying that those silly cloth masks are no good (as we’ve been saying for a long time), doubt is also finally being expressed that “deaths by COVID” may well not be as death BY COVID is a far different thing than death WITH COVID (like that infamous motorcycle rider who died in an accident but still labeled a COVID death because he “passed the test”). But I don’t have the time to go hunting for a better number so I’ll stick with the NH number.
And as for the Teachers Unions yammering about not having school, that SINGLE child of Government school age shows that the Union is about themselves and gaining more power than it is about protecting kids. And that single death (not yet attributed to being school-based) is on an entire NH Schools population of about 187,000 students. Not even within a rounding error of a rounding error range – it’s a complete outlier.
It’s been two years (and a few days) since the first COVID death, so I’ll use 730 days. The typical death rate was, back at my first posting was 31-32. Let’s use 31.
2,135 total deaths / 730 days =2.9 COVID deaths / day
So 2.9 + 31 = 33.9 total deaths per day of NH residents. A 9% increase, over two years, of Excess Deaths. Against a TOTAL NH population of 1.4 million people (and not just those infected). Thus from 0.0022% “normal death” for NH to 0.0024%. Sorry, against the entire NH population, those are rounding error ranges.
So, when are WMUR, Dr. Chan, and NH Governor Chris “Public Health trumps Everything!” Is Sununu going to ante up those numbers?
Sorry, but infection rates aren’t deaths (where that overall NH compute rate is 257,793 cases): 257,793/1,400,000 = 18.41%. Almost a quarter of the NH population. Nothing to sneeze at there.
But infections aren’t deaths and I revert back to the previous numbers.
Yes, an “epidemic” of infections but not one of deaths. And epidemics have generally been designated as deaths/populations (like 20-50% plus deaths of a given population). But we haven’t been given THAT type of context at that link either.
Without context, there can be panic. We see a similar thing with BLM and the current “Racist Porn” based on the 1619 Project – faulty history taught in schools, media hype, and suddenly we’re all racists/oppressors or victims/unable to help themselves due only to the color of one’s skin.
Both kinds of Panic Porn can be laid at the feet of our Government school system – and people not taking it upon themselves to do some real (and sometimes, really simple) research.