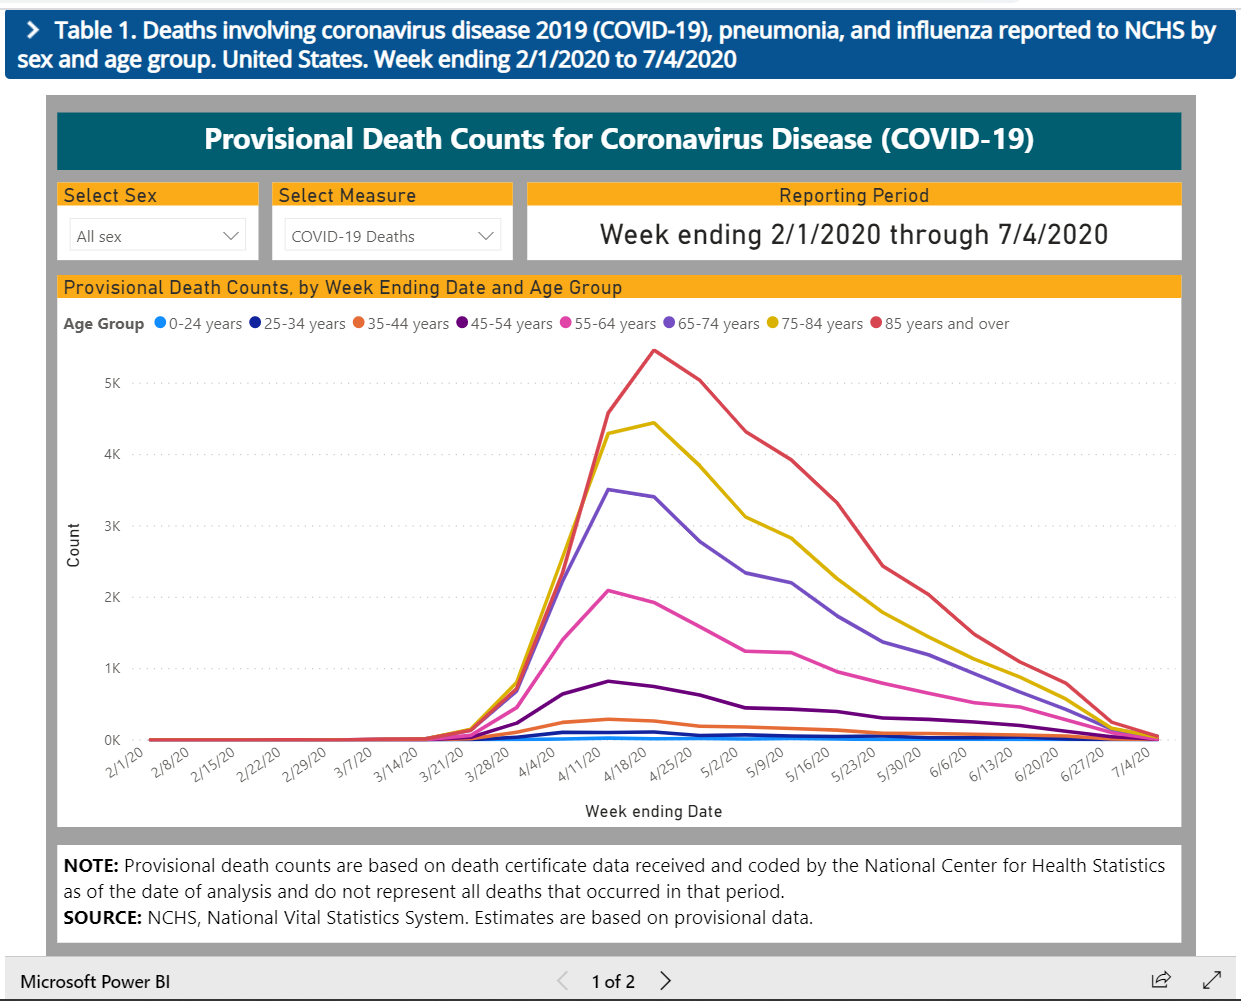
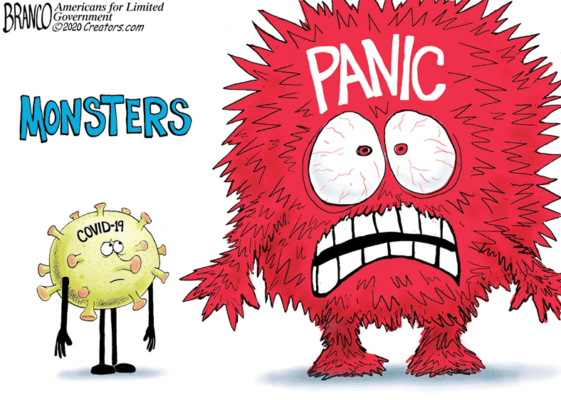
Looking at the CDC’s provisional weekly COVID death statistics (through July 4, 2020), what part of this graph tells you that we need to still be 1) wearing masks, 2) worried about sending kids back to school, 3) shutting down ANY part of ANY business or 4) listening to the media (ratings) and politicians (control, funding) – both still trying to keep us in fear for their own benefit?
The “curve” is WAY past flat here.
It’s time to get back to daily life, exercising our personal and economic freedoms, taking normal cold and flu precautions.
Take a minute to study the different age-based plotlines, noticing the total effects on each age group – particular those under 55 (disclosure: I am over 55 and I’ve not worn a mask, with a couple unavoidable exceptions).

