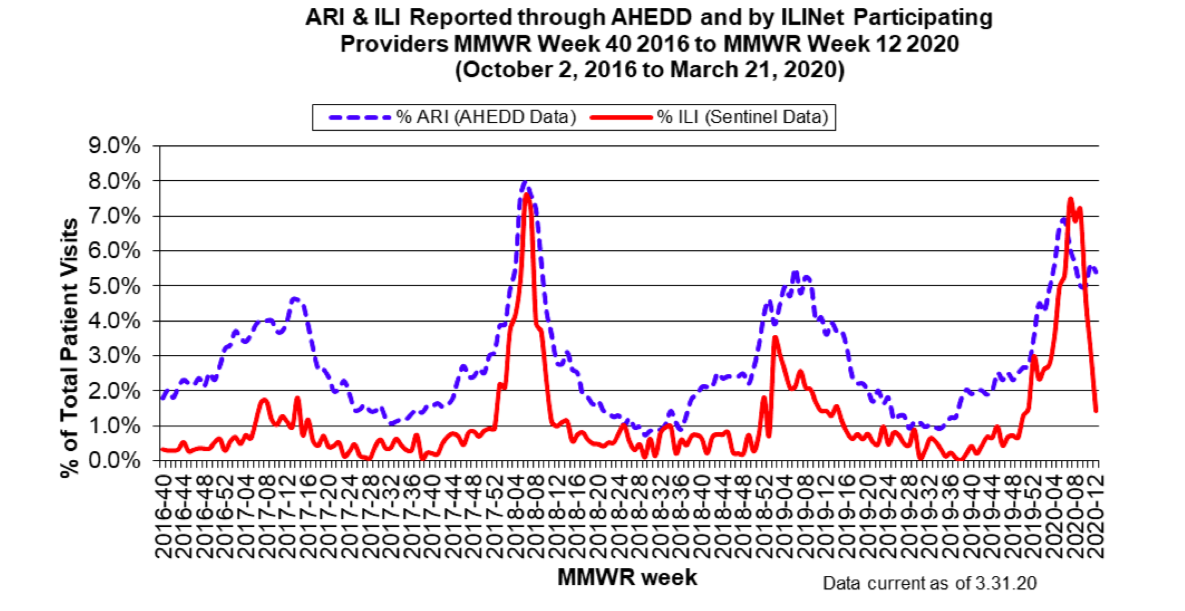
Back on March 21st, I posted about a theory by Julie Kelly of American Greatness that Coronavirus has been present in America much earlier than the forecasting models assume. Intuitively, it makes sense.
Coronavirus was present in China since at least November, 2019. China never attempted to prevent the virus from spreading beyond its borders and covered up the existence and nature of the virus for months. The World Health Organization declared the virus an international health emergency on January 30th. President Trump restricted travel with China the very next day. But that means China could have been seeding the United States with Coronavirus for three months.
Julie Kelly dug into the data at CDC and found that the number of people complaining of “influenza-like illness,” defined as fever (temperature of 100°F or greater) and a cough and/or a sore throat spiked from mid-January into mid-February. There was a corresponding increase of testing for influenza (the flu), BUT testing indicated that a material number of people did NOT have the flu. Her theory is that these people actually had Coronavirus.
Fast forward to today:
More ILI data-digging to support possibility coronavirus has been widespread in US since late 2019, definitely into Jan-February 2020: https://t.co/GDn40VjoCO
— Julie Kelly 🇺🇸 (@julie_kelly2) April 5, 2020
The article by Tracy Beanz looked at the flu-data on a State level and concluded that Coronavirus was present in certain States since November, 2019:
Beanz’s article contains a link to a CDC site that shows Influenza-Like-Illness (ILI) activity on a State-by-State basis.
New Hampshire first reports high ILI for the week ending February 15th:

By the week ending February 29th, we were past the peak:

Clicking on New Hampshire on the map takes us to the underlying data from DHHS. This chart from DHHS depicts the timeline I described above:

Now consider the results from testing people who had symptoms of the flu:

Of the 309 tested from September 29th through March 28th, 133 … or materially more than a third … had flu-like symptoms, but did NOT have the flu. Needless to say, I can’t prove that these were cases of Coronavirus. But I haven’t heard a better explanation.
To be clear, I am not saying that Coronavirus peaked in February because 133 people had Coronavirus. I’m saying that Coronavirus peaked because the testing indicates that 1/3 of the cases we thought were the flu weren’t the flu … and this is representative of what was occurring in the larger population.
Stated slightly differently, many more people come down with the flu than are tested for the flu. According to the CDC, [m]ost people with flu symptoms are not tested because the test results usually do not change how you are treated.
We know, for example, that for the 2018-2019 flu season, we had twelve flu deaths in New Hampshire. With a mortality rate of .1% that suggests 12,000 cases of the flu. So clearly, the preceding chart does NOT show the total number of people with an ILI.
What the chart shows … when placed in context with what we know about Coronavirus … is that probably at least 1/3 of the people we thought had the flu during the peak two-weeks of ILI in February actually had Coronavirus.
This explanation also explains why the Murray Model is massively overestimating the impact of Coronavirus … for example, for yesterday the Murray Model projected 574 hospitalizations versus the 86 reported by DHHS. The peak is not two weeks ahead of us … it is 5 weeks in the rear-view mirror.
