Atwater California, population 28,000 give or take has had enough of the BS coming out of Sacramento. They are done with Gavin Newsome’s shelter-in-place shutdown theater. They have declared themselves a sanctuary city for businesses.

News – Politics – Opinion – Podcasts
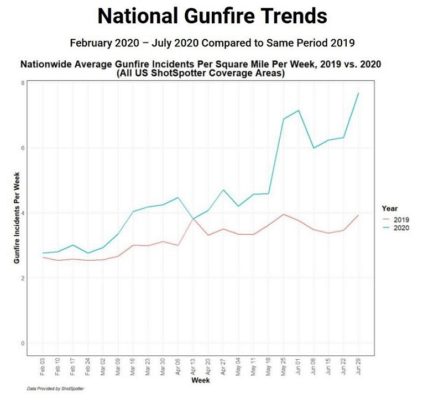
ShotSpotter has been tracking gunfire trends in response to the global pandemic followed by civil unrest in the US after the killing of George Floyd. The graph above shows gunfire per square mile per week across all ShotSpotter coverage areas in the US in the first half of 2020 and 2019. In 2020 gunfire appears … Read more
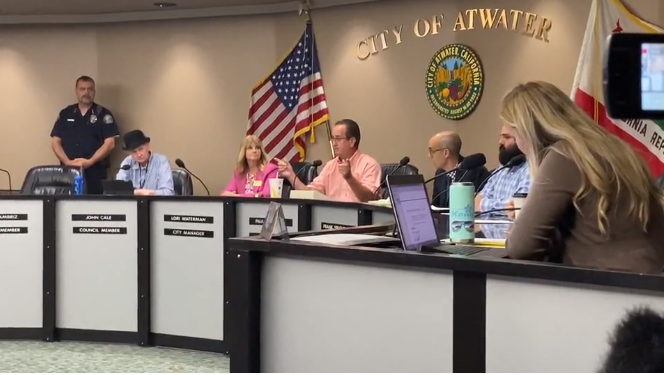
Atwater California, population 28,000 give or take has had enough of the BS coming out of Sacramento. They are done with Gavin Newsome’s shelter-in-place shutdown theater. They have declared themselves a sanctuary city for businesses.

This: It’s the job of the press to be asking questions like: “and how do you know that?” And if the answer is: “the Murray model,” to point out that the Murray model has been vastly overestimating the impact of Coronavirus on New Hampshire. But instead we are getting something more along the lines of … Read more

This from Associated Press yesterday: Coronavirus cases are expected to peak in New Hampshire sometime between the end of April and early May, the state’s health commissioner told the Executive Council on Wednesday. This “expectation” appears to be based on COVID Act Now, which Steve has posted about, which is based on the Imperial College … Read more
The Governor and Executive Council met this morning. Adam Sexton live-tweeted it. Among the tweets: This is most likely wrong. It is likely that COVID-19 has been present in New Hampshire since January, but we had been assuming that it’s the flu because we weren’t looking for COVID-19: We cannot maintain the status quo … Read more
Massachusetts Governor Charlie Baker has issued a ‘stay-at-home’ order effective Tuesday, March 24, at noon. It will be in effect for at least two weeks, until April 7 at noon. Governor Baker has said he can extend the order, if necessary. New Hampshire’s Governor Chris Sununu similarly warned this morning that citizens need to get … Read more

So check out this tweet, which inspired this post: Matty sure has a short memory. Per the CDC, 60.8 million Americans got sick and 12,468 died due to the H1N1 pandemic under President Obama, who took six months after the World Health Organization to declare an emergency. But that’s not what inspired this post. The … Read more

Yesterday, a shot was fired near the Dartmouth College campus, in Hanover, NH. It pains me to think of students (or anyone), sheltering in place, waiting in the dark, wondering what is going on – no sense of the moment or control over their destiny or fate. I picture a pen of lambs and sheep, … Read more