Between 2016 -2021 WMUR has published more than 150 articles about drought in New Hampshire. The headlines cry out for relief or predict doom. But yesterday, that same WMUR posted a tweet with this headline.
Flooding is an ongoing worry in New Hampshire and there are concerns that climate change will exacerbate it. In recent times, Concord experienced some of the wettest years on record. Learn more on why flood risk is expected to grow in the Granite State: https://t.co/eeHn2aMCO3 pic.twitter.com/5CWbkJe6XZ
— WMUR TV (@WMUR9) May 26, 2022
So, 2005 to 2010 are “recent years?”
It’s 2022. Why is DoubleYouEmYouAre fearmongering precipitation when they’ve published scores of articles on drought over the past few years?
Is it because they’ve published more articles warning about flooding?
WMUR posts an average of 40 articles a year with the word flooding in them. Drought gets about 25-30. So the answer is what?
It’s whatever gets eyeballs.
If we look at the tweet, they suggest that these decades-old precipitation numbers mean something today, and if you click the link, you get to this report. “Flood risk expected to grow in New Hampshire as temperatures rise.”
But the lead is rainfall numbers from 13 years ago. To borrow from Hilarity Clinton, at this point, what difference does it make? It’s a fair question.
Here are the total rainfall rankings according to NOAA from 2011 to 2021.
| Year | Rank |
| 2011 | 124 |
| 2012 | 77 |
| 2013 | 80 |
| 2014 | 102 |
| 2015 | 69 |
| 2016 | 27 |
| 2017 | 99 |
| 2018 | 117 |
| 2019 | 108 |
| 2020 | 48 |
| 2021 | 82 |
Not scary at all.
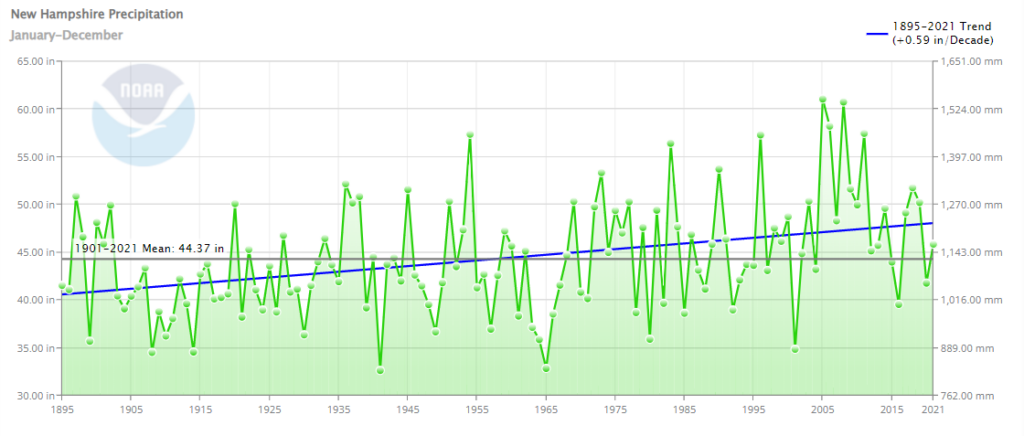
And I was unable to duplicate WMUR’s wettest years’ numbers, but two things become apparent when looking at NOAA’s graphed data. First, most of New Hampshire’s “wettest years” were between 2005 and 2011.
And second, it’s been less wet since 2011. So much so that WMUR regularly writes stories about drought, water restrictions, and so on.
Regular readers will know that we follow the Climate Cult’s Rube Goldbergian narratives on droughts and precipitation with a keen eye and have frequently deconstructed their nonsense, and here we are at it again.
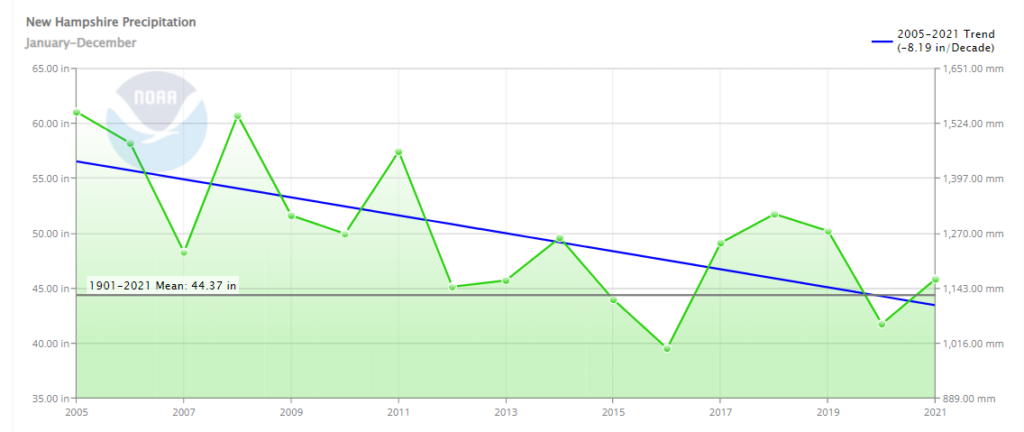
Let’s isolate precipitation from 2005-to 2021.
And the headline was what, again? “Flood risk expected to grow in New Hampshire as temperatures rise.”
Do rising temperatures mean more wetness? In meteorological theory, sure, but not based on real-world evidence.
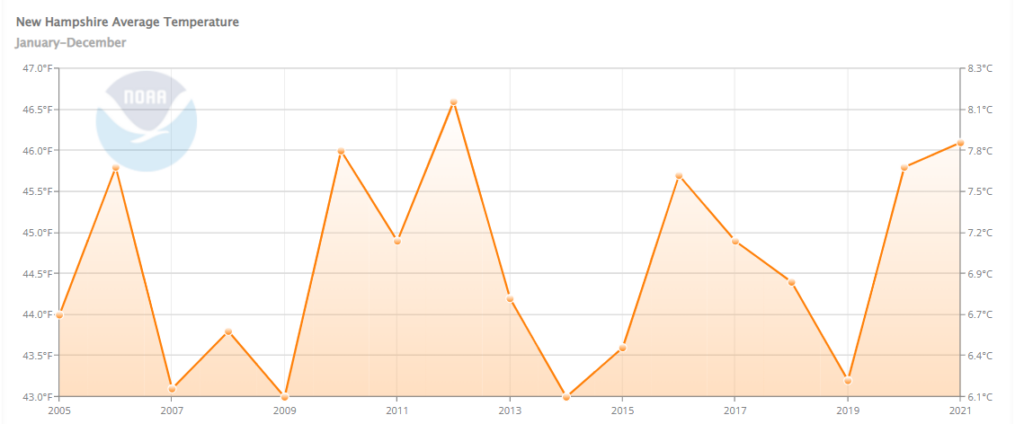
Average temp trends since 2005 are up slightly. The trend is warmer. But that did not result in more precipitation. We have less.
So what’s up with that? Looking back across 120 years, NH has gotten wetter as the solar maximum peaked at the beginning of this century. Warmer was wetter, and we are still slightly warmer than in 2005 to 2011, but we are not wetter.
There’s no there, there.
But that doesn’t matter. WMUR is using one of the Climate Cult’s favorite weapons. No, not the soft cushions, extreme weather, and more modernity. More people. They say this, but the difference between 2005 and 2021 is about 6000 humans. That’s about one person per 1.6 square miles.
But more homes and roads mean more hard surfaces, which equal rain runoff and more potential flooding, and oh, the weather’s been more extreme. That too!
Has it, or are they just saying that? I’d go with the latter.
And WMUR’s report is not absent facts, but it is misleading. And yes, it’s ABC, so that’s baked in, but they should have to include a disclaimer. We’ve arranged these details to create a perception that, based on past reporting, is probably not likely or even accurate.
While we’re at it, the Union Leader could use one too. Their tagline is “There is nothing so powerful as the Truth,” but anybody who reads it knows, “There’s nothing so powerful as deciding what truth to report.”
That’s what WMUR did, and the UL does it all the time. They all do. We do it, but we’re honest about that. A handful of unpaid opinion bloggers who, as it turns out, find themselves calling out the corporate media for their half-truths, deceptions, and outright omissions.
Someone has to do it.


