Stanford and UCLA wanted to know how many people you’d have to come into contact with before you might catch COVID19. They crunched data to determine the odds of contraction, if that would result in hospitalization, and then death. Per the Report, ‘actual risk may not align with public perceptions.’
Related: Federal Judge Rules COVID19 Lockdowns are Unconstitutional
No sh*t, really?
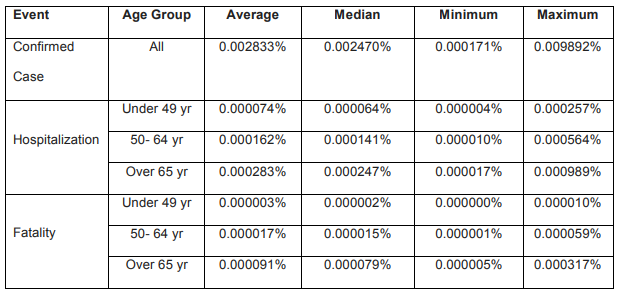
These estimates are based on the probability of the outcome based on your exposure to numbers of people*. Keep in mind that younger healthy people would be exponentially less likely to contract, suffer in any meaningful way, or die from COVID19 based on this analysis (see second table below).
Among US counties with populations greater than 500,000 people, during the week ending June 13, 2020, the median estimate of the county level probability of a confirmed infection is 1 infection in 40,500 person contacts (Range: 10,100 to 586,000). For a 50 to 64-year-old individual, the median estimate of the county level probability of a hospitalization is 1 in 709,000 person contacts (Range: 177,000 to 10,200,000) and the median estimate of the county level probability of a fatality is 1 in 6,670,000 person contacts (Range 1,680,000 to 97,600.000).
That’s a lot of people. And we know that transmission requires something like 15 minutes of moderate to close contact with an infected person. Based on a quick search, the largest possible number I could find for how many of these contacts you might have as an average person living the average lifespan is approximately 100,000, though a more realistic number for the everyday American is closer to 10,000.
Even if we go high use 100,000 and multiply by a factor of 10, we’re still way outside the range of variability for fatality in that age group and just above the statistical likelihood of hospitalization without death.
Contracting and then dying from COVID19 in this age group is not just highly improbable, it’s absurdly rare, so what does that mean. Well, based on data from the National Safety Council, you are more likely to die from any number of common everyday activities in your life than from COVID19.
Let’s call it a list of things for which governors have never “locked down” a community, closed their business, unemployed their workers, or any of the other bullsh*t that has been demanded of us.
These are based on actual rates of death for the noted cause. For example, 1 in 7 Americans will die form heart disease or cancer.
| Heart Disease and Cancer | 1 in 7 |
| Chronic Lower Respiratory Disease | 1 in 28 |
| Intentional Self-harm | 1 in 95 |
| Unintentional Poisoning by and Exposure to Noxious Substances | 1 in 96 |
| Motor Vehicle Crash | 1 in 114 |
| Fall | 1 in 127 |
| Assault by Firearm | 1 in 370 |
| Car Occupant | 1 in 645 |
| Pedestrian Incident | 1 in 647 |
| Motorcycle Rider Incident | 1 in 985 |
| Unintentional Drowning and Submersion | 1 in 1,188 |
| Exposure to Fire, Flames or Smoke | 1 in 1,498 |
| Choking from Inhalation and Ingestion of Food | 1 in 3,461 |
| Pedacyclist Incident | 1 in 4,486 |
| Firearms Discharge | 1 in 6,905 |
| Air and Space Transport Incidents | 1 in 9,821 |
| Exposure to Electric Current, Radiation, Temperature and Pressure | 1 in 15,212 |
| Exposure to Excessive Natural Heat | 1 in 16,584 |
| Contact with Sharp Objects | 1 in 38,174 |
| Contact with Heat and Hot Substances | 1 in 56,992 |
| Contact with Hornets, Wasps and Bees | 1 in 63,225 |
| Cataclysmic Storm | 1 in 66,335 |
| Being Bitten or Struck by a Dog | 1 in 112,400 |
| Legal Execution | 1 in 119,012 |
| Lightning Strike | 1 in 161,856 |
THis is obviously more of an apples ot organges thing. I’m no statistician so I won’t try to translate the Stanford UCLA data to fit this table but the idea is to provide a sense of scope.
I also think the National Safety Council needs a new category. Liklihood of death from arbitrary acts of political force for no good reason that resulted in you dying of suicide. Make sure you have a line item specifically for suicide as a result of the COVID19 fraud.
And I’ll leave you with this from the Stanfaord – UCLA report. A Table with probabilities for other age groups as a percentage.

You can get closer to zero but not by much.
