
You really DO want to go! If you enjoy a turn of phrase as much as I do (being a blogger), you will want to listen to the guy that wrote this:
Some days ago, a prolix, inspissate whigmaleerie was posted here – a gaseous halation, an unwholesome effluvium, an interminable and obscurantist expatiation purporting to cast doubt upon my team’s conclusion that official climatology has misdefined and misapplied feedback and has thus made a mountain out of a molehill, approximately tripling the true midrange rate of global warming we can expect our sins of emission to engender.
(H/T: WattsUpWithThat)
That would be by Lord Christopher Monckton, one of the debaters tonite at Manchester’s Nackey Loeb School of Communications (749 East Industrial Park Drive) St. Anselms Institute of Politics. BTW, go read the whole article. He isn’t just a Royal Peer of the Realm, he really knows his stuff – like this!
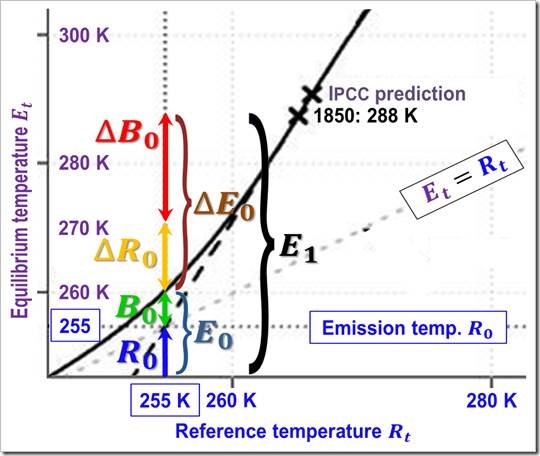
We define emission temperature R0 as the 255 K global mean surface temperature that would obtain on Earth at today’s solar irradiance and albedo but before any greenhouse gases have entered the atmosphere and before any feedback begins to operate; B0 as the feedback response in Kelvin to R0; E0, the sum of R0 and B0, as the equilibrium temperature that would prevail after feedback has responded to emission temperature; ΔR0 as the 10 K reference sensitivity to the naturally-occurring, noncondensing, preindustrial greenhouse gases; ΔB0 as the feedback response to B0; ΔE0, the sum of ΔR0and ΔB0, as the equilibrium sensitivity to the preindustrial noncondensing greenhouse gases present in 1850; R1, the 265 K sum of R0 and ΔR0, as the reference temperature (not including feedback responses) in 1850; B1, the sum of B0 and ΔB0, as the total feedback response to 1850; and E1, the sum of R1 and B1, as the observed equilibrium temperature (including feedback responses) in 1850. The graph above, a detail from Fig. 1 of the whigmaleerie, shows B0 as 5 K and ΔE0 as 28 K, implying that ΔB0 is 18 K or thereby.
Relationships between this gallimaufry of variables constituting the equilibrium global mean surface temperature in 1850 are shown below, where a0, the ratio of ΔE0 to ΔR0, is the system-gain factor or closed-loop gain that transforms reference sensitivity ΔR0before feedback to equilibrium sensitivity ΔR0 after feedback.
Doors open at 6:30pm