


From a political outlook, see where the population densities are: “If you look at the ‘red’ spots on the map, you will notice that most of the population is concentrated on the West and East coasts.”
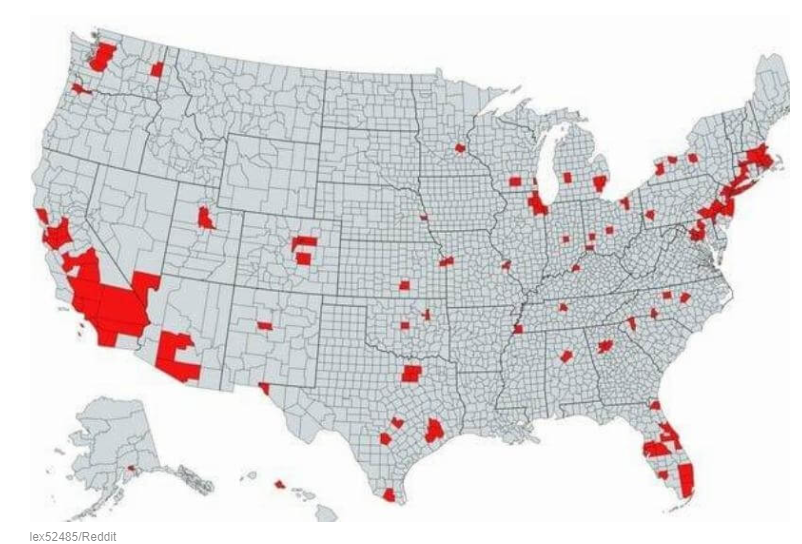
Next:
Essentially, the population size in red is equal to the population size in orange. That means almost the same amount of people live on the coasts, as almost all of middle America.
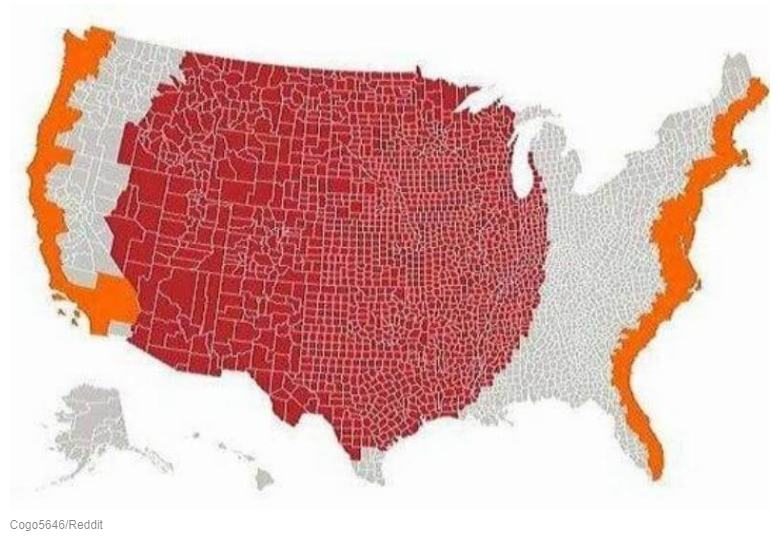
There’s a reason why we Conservatives hate the “Coasties” that generally run roughshod over the politics as they definitely fall Left: North Atlantic Seaboard and California/Washington. Because look at where the Flyover Country leans:
(H/T: Travlers)
