

Here’s a graph of NAEP (the National Assessment of Educational Progress) results, by state: 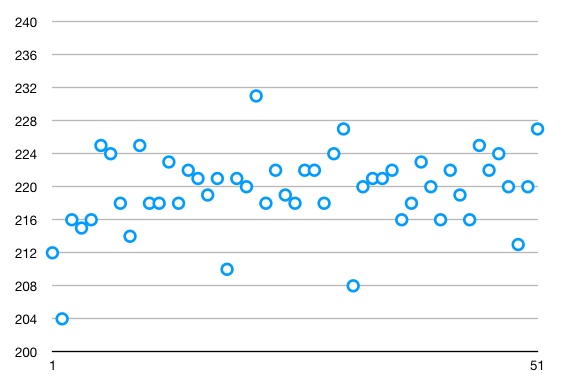
This is for 4th grade reading, but the graphs for every grade and subject tell a similar story.
It looks like there’s some real variation there, right? Some states are doing better. (They are ‘among the best’, as people in those states like to say.) Others are doing worse.
But here’s something you’re supposed to learn in a basic algebra course. When you make a graph, the choice of scales for the axes can be used to inform, or to mislead.
NAEP scores range from 0 to 500. If we show the whole range on the graph, it looks like this:
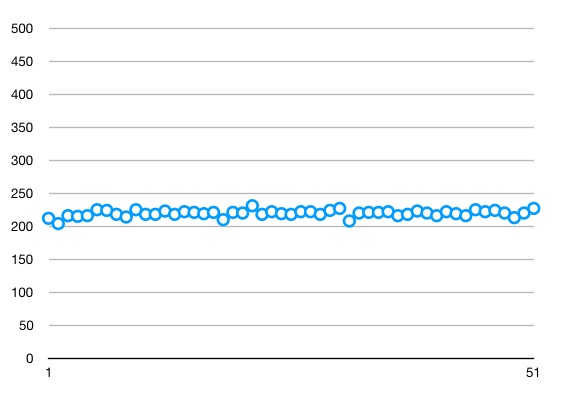
The story told by this picture is much closer to the truth: All states are getting pretty much the same results, none of them very good. (The equivalent of a ‘passing score’ — not good, just barely acceptable — would be around 240, a score achieved by none of the states.)
Keep in mind that NAEP is the test created by the educational establishment using their own criteria for how they want to be judged.
Think about this graph the next time you hear someone talking about how New Hampshire needs to resist changes (like the Learn Everywhere program, or more charter schools, or expanded school choice) because it has ‘one of the best’ public school systems in the country.
The truth is, they all suck, and New Hampshire’s sucks just a teensy bit less than the rest.