

The problem with focusing fear on the number of COVID19 cases is that the more people who “get this” (real or imagined), the more ridiculous the political response becomes. More cases will crater already low mortality rates, so we should look at hospitalizations. No, that’s not good for the political response either.
Related: …The Political Response is Killing People
New Hampshire has been under emergency order since April making December the tenth consecutive month with some sort of executive overreach based on the flu we call COVID19.
Early on, our liberties were infringed on the idea that we did not want to overwhelm hospitals, and while that held water for a few weeks (because we knew nothing), that bucket could not sustain much as reality dawned over their darkened-days propaganda.
It’s a contagious flu, but few need to fear it. That’s why the domestic terror campaign changed buckets. They shifted to cases. But cases only matter in the context of hospitalizations (the original bucket), and there is no correlation between the two while a serious threat continues in direct correlation to the political response.
As for COVID19 in New Hampshire, the data tell us there has never been any real threat regardless of the number of cases. The proof is online in the State’s COVID19 dashboard and in national data on New Hampshire.
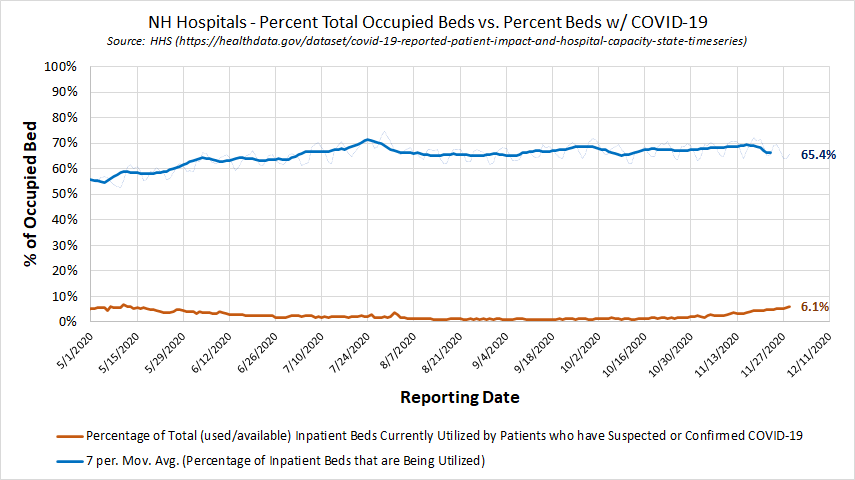
First up, the percent total of occupied hospital beds in the state vs. the percentage of beds for COVID19.
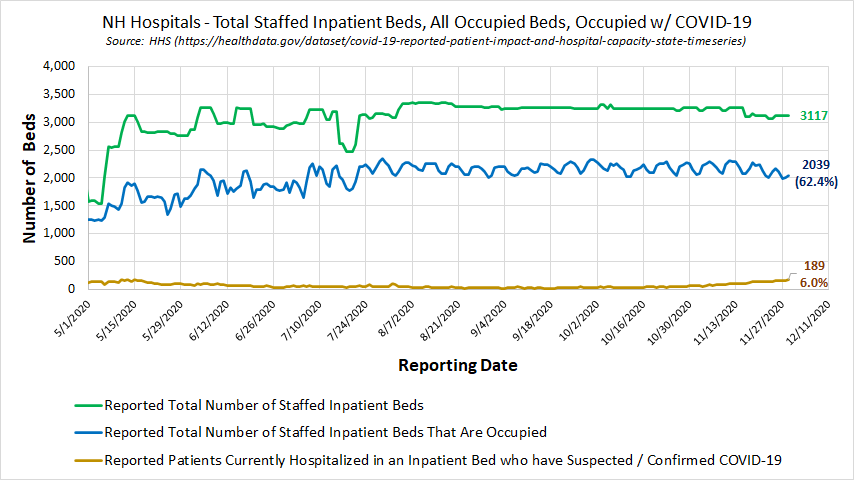
Next up is total beds, occupied beds, and covid beds.
And finally, total ICU beds, total ICU beds occupied (all patients), and those occupied with COVID patients.
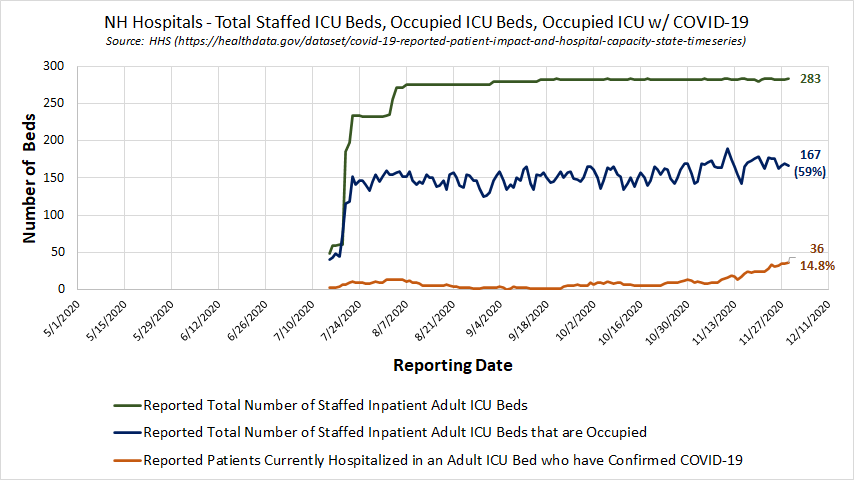
There’s really not much I need to say. The data tells us that there’s no crisis and that regardless of the number of cases. We see a slight uptick in COVID ICU bed use across the state but at no point, no matter how breathless the media and politicians have been about the number of cases, do I see any justification for the infringements forced upon us by those who were elected to serves us but continue to serve some other master.
A few notes from my data crunchera at RebuildNH:
- These three charts show the hospital occupancy in New Hampshire going back a couple of months expressed in absolute numbers and percent of total capacity.
- The total inpatient occupancy started reporting in early April and doesn’t look like all hospitals were online until mid-to-late May. It appears the ICU reporting didn’t start until July.
- There is a discrepancy between this data and NH DHHS. On 11/29, NH DHHS was reporting about 146 total hospitalizations (versus 189 for US HHS for the same day).