


New Hampshire voters are hearing some starkly different claims about Question 2, the school property-tax cap on this November’s ballot.
People who are urging you to vote no on Question 2 are mischaracterizing it as a cut to school budgets.
But the question asks whether growth in the local property-taxshould be limited for two years to inflation (with some exceptions). The cap can be overridden by a 3/5 vote at any annual meeting or vote. There’s no reason not to vote for it, just on its face.
However, many reasons are being given to vote against it. Three of the most prominent are:
“We’re spending $20,000 per student, so schools must be wasteful.”
No. Falling enrollment automatically increases per-pupil spending, even without a spending increase.
“School budgets are already cut to the bone.”
The statewide numbers don’t support such a sweeping claim. Inflation-adjusted spending increased 36 percent (to the tune of $1 billion) while enrollment fell 19 percent, and total staffing increased rather than decreased.
“There is nowhere to cut because the spending is mandated.”
Schools have significant mandated costs, but the data show substantial growth across numerous spending and staffing categories. Whether all of that growth remains necessary is exactly the question worth asking.
These arguments are based on rhetoric (such as characterizing slowed growth as cuts) rather than data. So I looked at the data.
The question is whether there is enough flexibility in school spending to make a limit on property-tax growth reasonable.
I think the answer is yes, and below I will discuss these three misconceptions that lead some people to think the answer is no.
But perhaps the biggest issue that no one is talking about is this:
New Hampshire’s district public schools have spent $1 billion more per year than we were 20 years ago, employed more people and served substantially fewer students, while producing no significant improvements in academic achievement. What are we getting for that extra $1 billion? If school boards can’t answer that, then they have no business asking for any increases, and in fact should be looking at cuts that would allow them to give that money back to taxpayers. That would be responsible governance.
That may be a much more useful discussion to have than simply asking how much schools want to spend next year. But I digress.
Misconception #1: $20,000 per student proves spending is out of control
It doesn’t.
Cost per pupil is simply spending divided by the number of students.
If a district spends $1 million on 100 students, it spends $10,000 per student. If enrollment falls to 80 students and the district continues spending exactly $1 million, its cost per pupil jumps to $12,500 — with no increase in spending at all.
Similarly, if enrollment rises to 120 students, the cost per pupil would fall to about $8,300 — with no reduction in spending.
That’s especially important in New Hampshire because enrollment has fallen substantially.
In 2000–01, New Hampshire public schools enrolled 208,461 students. By 2022–23, that had fallen to 168,909 — a decline of nearly 40,000 students, or 19 percent.
So yes, declining enrollment has pushed up the cost per student.
But that’s not the end of the story.
Misconception #2: School systems have simply been absorbing unavoidable costs while cutting everything else to the bone
This isn’t true either.
In 2000–01, New Hampshire district public schools spent about $1.52 billion in current expenditures. Adjusted for inflation, that’s approximately $2.60 billion in 2022–23 dollars.
Actual 2022–23 spending was about $3.54 billion.
So this is the comparison that matters:
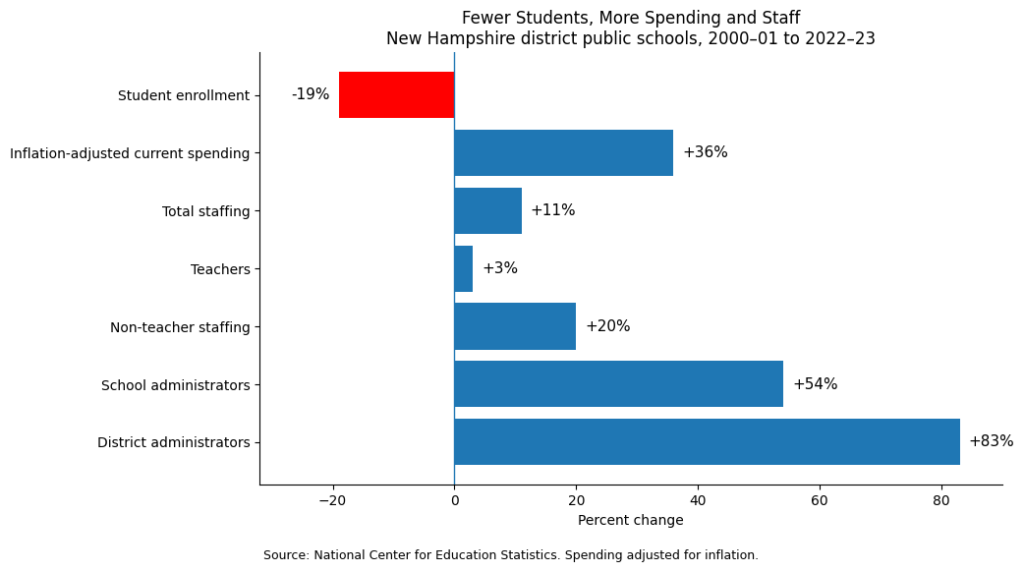
The staffing figures come from the National Center for Education Statistics. NCES reports 28,055 total staff in New Hampshire in fall 2000, including 14,341 teachers; by fall 2022 there were 31,198 staff, including 14,731 teachers.
Think about what that means.
New Hampshire’s district public schools were educating nearly 40,000 fewer students, yet employing more than 3,000 additional people.
The number of teachers barely changed. Much of the growth was elsewhere.
That doesn’t prove those additional employees are unnecessary. Schools may be providing services today that they didn’t provide 20 years ago. Student needs may have changed. Special education is certainly part of the story.
But the numbers are difficult to reconcile with the claim that school systems have simply been absorbing unavoidable costs while cutting everything else to the bone.
The system didn’t shrink as enrollment declined.
It grew.
Misconception #3: There’s Nothing to Cut Because the Spending Is Mandated
This is the claim that most merits examination.
Schools absolutely do have mandated expenses. Special education is the most obvious example, and it’s expensive.
But “schools have mandates” is not the same statement as “everything in the school budget is mandated.”
Our spending data show substantial growth across many different functions.
Inflation-adjusted spending on instruction increased about 30 percent from 2000–01 to 2022–23.
(It’s worth nothing that sports and other extracurriculars are included under “instruction,” which is not very transparent.)
But support services increased about 53 percent. Student support increased about 77 percent. Instructional-staff support increased about 66 percent. General administration increased about 43 percent.
And staffing tells the same story. School-administrator positions increased more than 50 percent, while district-administrator positions increased more than 80 percent.
Some of that growth may be worthwhile.
But it isn’t credible to look at a system that has added staff while losing 19 percent of its students and conclude, without further examination, that there is simply nowhere to economize.
That’s precisely the examination voters should be asking school boards to undertake.
What About Special Education?
Special education complicates this picture considerably.
The number of New Hampshire students receiving special-education services has remained surprisingly stable — roughly 30,000 at both ends of the period we examined—but the cost of providing those services has increased substantially.
And those costs aren’t conveniently contained in one budget line. Some appear under special programs. Others — psychological services, speech and audiology, occupational therapy, specialized transportation and more — appear elsewhere.
A more comprehensive analysis of 2022–23 spending attributed approximately $915 million, or about 24 percent of school operating costs, to disability-related services. That’s a major expense and one that districts can’t simply choose not to provide.
But it still doesn’t explain away the broader spending and staffing trends.
“Some school spending is mandated” and “school budgets contain no discretionary or reducible spending” are two very different claims.
And there’s one more piece of context worth considering. If all this additional spending and staffing had produced better academic results – which they have not – that would be an important part of the story. But broad NAEP measures show no long-term improvement in student achievement.
Data note: Enrollment, staffing and expenditure figures are from the National Center for Education Statistics. Spending comparisons use current expenditures and adjust older figures for inflation. Current expenditures exclude major capital expenditures and debt interest. The analysis concerns traditional district public-school expenditures rather than charter-school spending. Figures are rounded.
